

So,I decided to plot them with pylab. This is the script I made
from numpy import sin,cos,linspace,pi
import pylab

# curve parameters
R = 14
r = 1
d = 18

t = linspace(0,2*pi,300)

# Epitrochoid parametric equations
x = (R-r)*cos(t)-d*cos( (R+r)*t / r )
y = (R-r)*sin(t)-d*sin( (R+r)*t / r )

pylab.plot(x,y,'r')
pylab.axis('equal')
pylab.show()
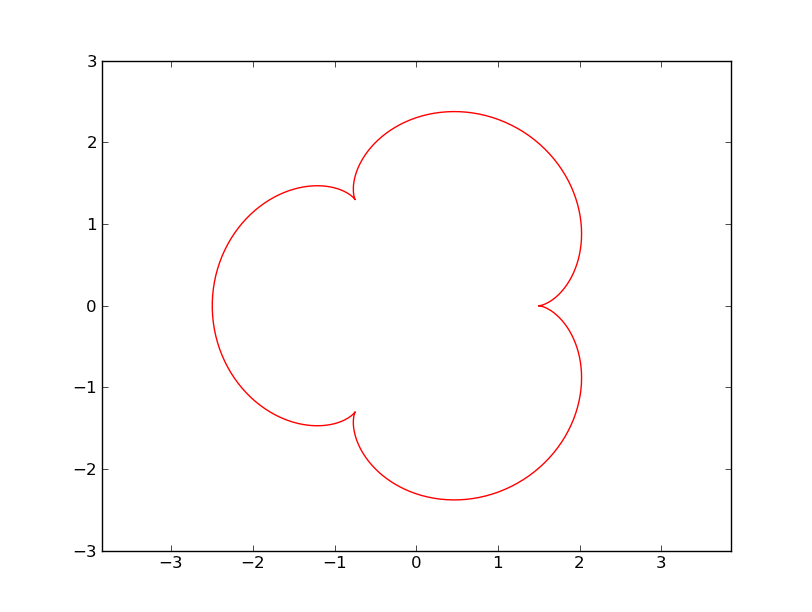
And this is the result

Varying the parameters R, r and d we can plot an infinity of different curves. The following plot is made with R = 6, r = 1, d = 6

No comments:
Post a Comment
Note: Only a member of this blog may post a comment.