import pandas as pd

data_url = 'ftp://aftp.cmdl.noaa.gov/products/trends/co2/co2_weekly_mlo.txt'
co2_data = pd.read_csv(data_url, sep='\s+', comment='#', na_values=-999.99,
                       names=['year', 'month', 'day', 'decimal', 'ppm',
                       'days', '1_yr_ago',  '10_yr_ago', 'since_1800'])

co2_data['timestamp'] = co2_data.apply(lambda x: pd.Timestamp(year=int(x.year),
                                                             month=int(x.month),
                                                             day=int(x.day)),
                                       axis=1)
co2_data = co2_data[['timestamp', 'ppm']].set_index('timestamp').ffill()
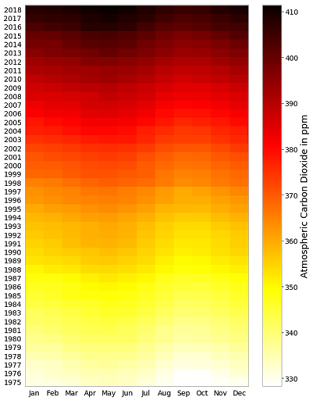
Then, we group the it by year and month at the same time storing the result in a matrix where each element represents the concentration in a specific year and month:
import numpy as np
import matplotlib.pyplot as plt
from calendar import month_abbr

co2_data = co2_data['1975':'2018']
n_years = co2_data.index.year.max() - co2_data.index.year.min()
z = np.ones((n_years +1 , 12)) * np.min(co2_data.ppm)
for d, y in co2_data.groupby([co2_data.index.year, co2_data.index.month]):
  z[co2_data.index.year.max() - d[0], d[1] - 1] = y.mean()[0]

plt.figure(figsize=(10, 14))
plt.pcolor(np.flipud(z), cmap='hot_r')
plt.yticks(np.arange(0, n_years+1)+.5,
           range(co2_data.index.year.min(), co2_data.index.year.max()+1));
plt.xticks(np.arange(13)-.5, month_abbr)
plt.xlim((0, 12))
plt.colorbar().set_label('Atmospheric Carbon Dioxide in ppm')
plt.show()
This visualization makes us able to compare the CO2 levels month by month with single glance. For example, we see that the period from April to June gets dark quicker than other periods, meaning that it contains the highest levels every year. Conversely, the period that goes from September to October gets darker more slowly, meaning that it's the period with the lowest CO2 levels. Also, looking at the color bar we note that in 43 years there was a 80 ppm increase.
Is this bad for the planet earth? Reading Hansen et al. (2008) we can classify CO2 levels less than 300 ppm as safe, levels between 300 and 350 ppm as dangerous, while levels beyond 350 ppm are considered catastrophic. According to this, the chart is a sad picture of how the levels transitioned from dangerous to catastrophic!
Concerned by this situation I created the CO2 Forecast twitter account where I'll publish short and long term forecasts of CO2 levels in the atmosphere.

