import numpy as np
import scipy.stats as sps
import matplotlib.pyplot as plt

def sum_random_variables(*kwarg, sp_distribution, n):
    # returns the sum of n random samples
    # drawn from sp_distribution
    v = [sp_distribution.rvs(*kwarg, size=100000) for _ in range(n)]
    return np.sum(v, axis=0)
This function takes in input the parameters of the distrubution, the function that implements the distrubution and n. It returns an array of 100000 elements, where each element is the sum of n samples. Given the Central Limit Theorem, we expect that the values in output are normally distributed if n is big enough.
To verify this, let's consider a beta distribution with parameters alpha=1 and beta=2, run our function increasing n and plot the histogram of the values in output:
plt.figure(figsize=(9, 3))
N = 5
for n in range(1, N):
    plt.subplot(1, N-1, n)
    s = sum_random_variables(1, 2, sp_distribution=sps.beta, n=n)
    plt.hist(s, density=True)
plt.tight_layout()
On the far left we have the histogram with n=1 , the one with n=2 right next to it, and so on until n=4. With n=1 we have the original distribution, which is heavily skewed. With n=2 we have a distribution which is less skewed. When we reach n=4 we see that the distribution is almost symmetrical, resembling a normal distribution.
Let's do the same experiment using a uniform distribution:
plt.figure(figsize=(9, 3))
for n in range(1, N):
    plt.subplot(1, N-1, n)
    s = sum_random_variables(1, 1, sp_distribution=sps.beta, n=n)
    plt.hist(s, density=True)
plt.tight_layout()
Here we have that for n=2 the distribution is already symmetrical, resembling a triangle, and increasing n further we get closer to the shape of a Gaussian.
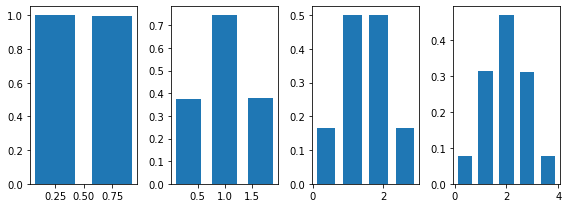
The same behaviour can be shown for discrete distributions. Here's what happens if we use the Bernoulli distribution:
plt.figure(figsize=(9, 3))
for n in range(1, N):
    plt.subplot(1, N-1, n)
    s = sum_random_variables(.5, sp_distribution=sps.bernoulli, n=n)
    plt.hist(s, bins=n+1, density=True, rwidth=.7)
plt.tight_layout()
We see again that for n=2 the distribution starts to be symmetrical and that the shape of a Gaussian is almost clear for n=4.


