Wednesday, July 6, 2011

How to use reflection

A simple code snippet that use reflection to print names of attributes, methods and doc strings:
class Obj:
 """ An object that use reflection """

 def __init__(self,name):
  """ the constructor of this object """
  self.name = name

 def print_methods(self):
  """ print all the methods of this object and their doc string"""
  print '\n* Methods *'
  for names in dir(self):
   attr = getattr(self,names)
   if callable(attr):
    print names,':',attr.__doc__

 def print_attributes(self):
  """ print all the attributes of this object and their value """
  print '* Attributes *'
  for names in dir(self):
   attr = getattr(self,names)
   if not callable(attr):
    print names,':',attr

 def print_all(self):
  """ calls all the methods of this object """
  for names in dir(self):
   attr = getattr(self,names)
   if callable(attr) and names != 'print_all' and names != '__init__':
    attr() # calling the method

o = Obj('the my object')
o.print_all()
Which gives the following output:
* Attributes *
__doc__ :  An object that use reflection 
__module__ : __main__
name : the my object

* Methods *
__init__ :  the constructor of this object 
print_all :  calls all the methods of this object 
print_my_attributes :  print all the attributes of this object 
print_my_methods :  print all the methods of this object 

Monday, July 4, 2011

How to plot biorhythm

The following script plot the biorhythm of a person born in 14/3/1988 in a range of 20 days.
from datetime import date
import matplotlib.dates
from pylab import *
from numpy import array,sin,pi

t0 = date(1988,3,14).toordinal()
t1 = date.today().toordinal()
t = array(range((t1-10),(t1+10))) # range of 20 days

y = 100*[sin(2*pi*(t-t0)/23),  # Physical
         sin(2*pi*(t-t0)/28),  # Emotional
         sin(2*pi*(t-t0)/33)]; # Intellectual

# converting ordinals to date
label = []
for p in t:
 label.append(date.fromordinal(p))

fig = figure()
ax = fig.gca()
plot(label,y[0],label,y[1],label,y[2])
# adding a legend
legend(['Physical', 'Emotional', 'Intellectual'])
# formatting the dates on the x axis
ax.xaxis.set_major_formatter(matplotlib.dates.DateFormatter('%d/%b'))

show()
The resulting graph:

Friday, July 1, 2011

Approximating pi

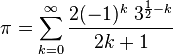
This script uses the following formula
to approximate the value of pi with a fixed number of correct digits.
import math
def pi(digits):
 k = 0
 pi = 0.0
 e = 1.0
 tol = pow(10,-digits) # is minimum error that we want to accept
 while e > tol:
  pi_old = pi
  pi += (2*pow(-1,k)*pow(3,.5-k))/(2*k+1)
  e = abs(pi-pi_old) # current error
  k += 1
  print '%0.16f %20.16f' % (pi,e)
 print '\nerror',e,'\niterations ',k
 print '%0.16f' % pi,'result'
 print '%0.16f' % math.pi,'real pi'

pi(8) # approximating pi with 8 correcet digits
During the execution you can see the current approximated value on the left column and the difference with the approximation at the previous step on the right column. At the end, the difference between the approximated value and the value provided by the math python module will be printed.
$ python pi.py 
3.4641016151377544   3.4641016151377544
3.0792014356780038   0.3849001794597506
3.1561814715699539   0.0769800358919501
3.1378528915956800   0.0183285799742738
3.1426047456630846   0.0047518540674045
3.1413087854628832   0.0012959602002014
3.1416743126988376   0.0003655272359544
3.1415687159417840   0.0001055967570536
3.1415997738115058   0.0000310578697218
3.1415905109380802   0.0000092628734256
3.1415933045030817   0.0000027935650015
3.1415924542876463   0.0000008502154354
3.1415927150203800   0.0000002607327336
3.1415926345473140   0.0000000804730660
3.1415926595217138   0.0000000249743999
3.1415926517339976   0.0000000077877162

error 7.78771624965e-09 
iterations  16
3.1415926517339976 result
3.1415926535897931 real pi